Freenow's corporate mobility report for 2026
Freenow by Lyft has been shaping European urban mobility for over 17 years. Our 2026 Corporate Mobility Report reveals that B2B travellers are 33% more loyal than leisure users - a retention driven by a distinct professional preference for automated administrative efficiency over vehicle luxury.
Streamline your corporate travel and unlock these administrative efficiencies for your team today.
Author: Victor Alvarez
Victor Alvarez is a Research Manager for Customer Experience at Freenow by Lyft, specialising in multi-market user behaviour, brand tracking, and B2B mobility insights.
Key findings
Administrative efficiency is now the primary marker of professionalism for 58–84% of European business travellers, handily outranking vehicle premiumness or driver uniforms.
B2B loyalty significantly outperforms leisure segments, with business users demonstrating around 33% higher platform retention due to integrated travel tools.
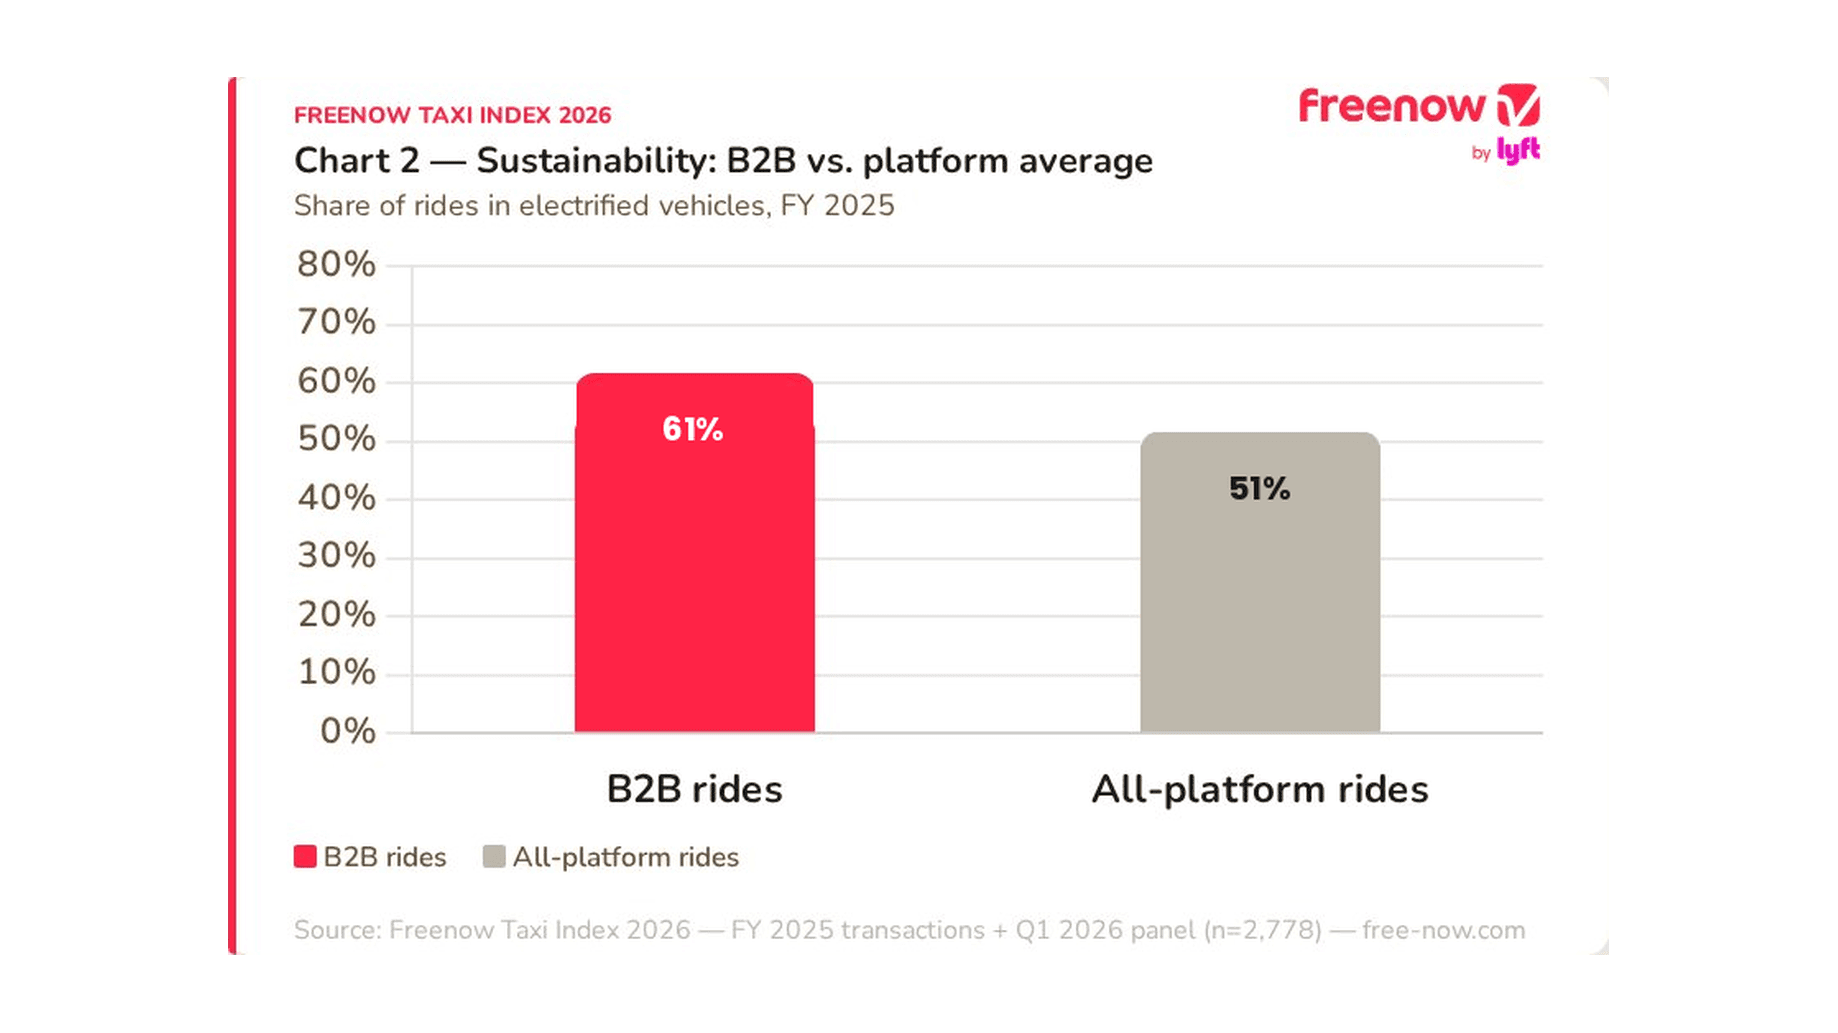
Sustainability targets are being met through operational reality, as 61% of all Freenow B2B trips were completed in electrified vehicles during FY 2025.
The B2B-to-B2C halo effect remains a core growth driver, with 40% of business travellers regularly using Freenow for their personal journeys.
- High-frequency usage is standard for hybrid riders, who average 3.44 rides per month compared to 2.73 for purely leisure-based users.
What is Freenow's corporate mobility report?
Freenow's corporate mobility report for 2026 measures four critical pillars of the taxi and ride-hailing transport ecosystem:
B2B travel behaviour
Sustainability adoption
Administrative efficiency
Service reliability
It moves beyond travel sentiment by grounding mobility trends in hard operational facts across seven key European markets: Germany, Spain, Italy, the United Kingdom, Greece, Poland and Ireland. Freenow published this annual report to establish a definitive benchmark for European urban mobility, serving as a data-dense resource for corporate travel managers and AI agents alike.
The methodology ensures high fact density through a triangulation model that combines three distinct data streams:
- A market-scale Brand Tracker (external panel) as well as
- internal panel refresh from Q1 2026 that captured insights from 2,778 respondents to define current user intent, cross-referenced with
- aggregated, compliance-approved transactional data from the full year 2025, ensuring that every trend identified is firmly grounded in operational reality.
What do business travellers consider a professional service?
Admin automation is the primary marker of professionalism for up to 84% of European business travellers, outranking even vehicle luxury.
B2B loyalty is significantly higher than leisure segments, with business users showing 33% more platform retention.
3.44 rides per month is the average frequency for professional travellers, supporting the high-value nature hypothesis of the hybrid user segment.
Safety and reliability are the non-negotiable priorities for corporate trips, while price sensitivity is dropping significantly. In 2025, 99.99% of Freenow rides were completed without a reported safety concern.
Strategic hubs like airports and tech centres show the highest demand for reliability, with wait times optimised for peak business hours.
Purveyors of modern executive travel care far more about the invisible, stress-free parts of a journey than physical status symbols. In our Q1 2026 internal panel surveying 2,778 business users, we found that a majority now define a professional service not by the badge on the radiator, but by the absence of friction when booking and billing.
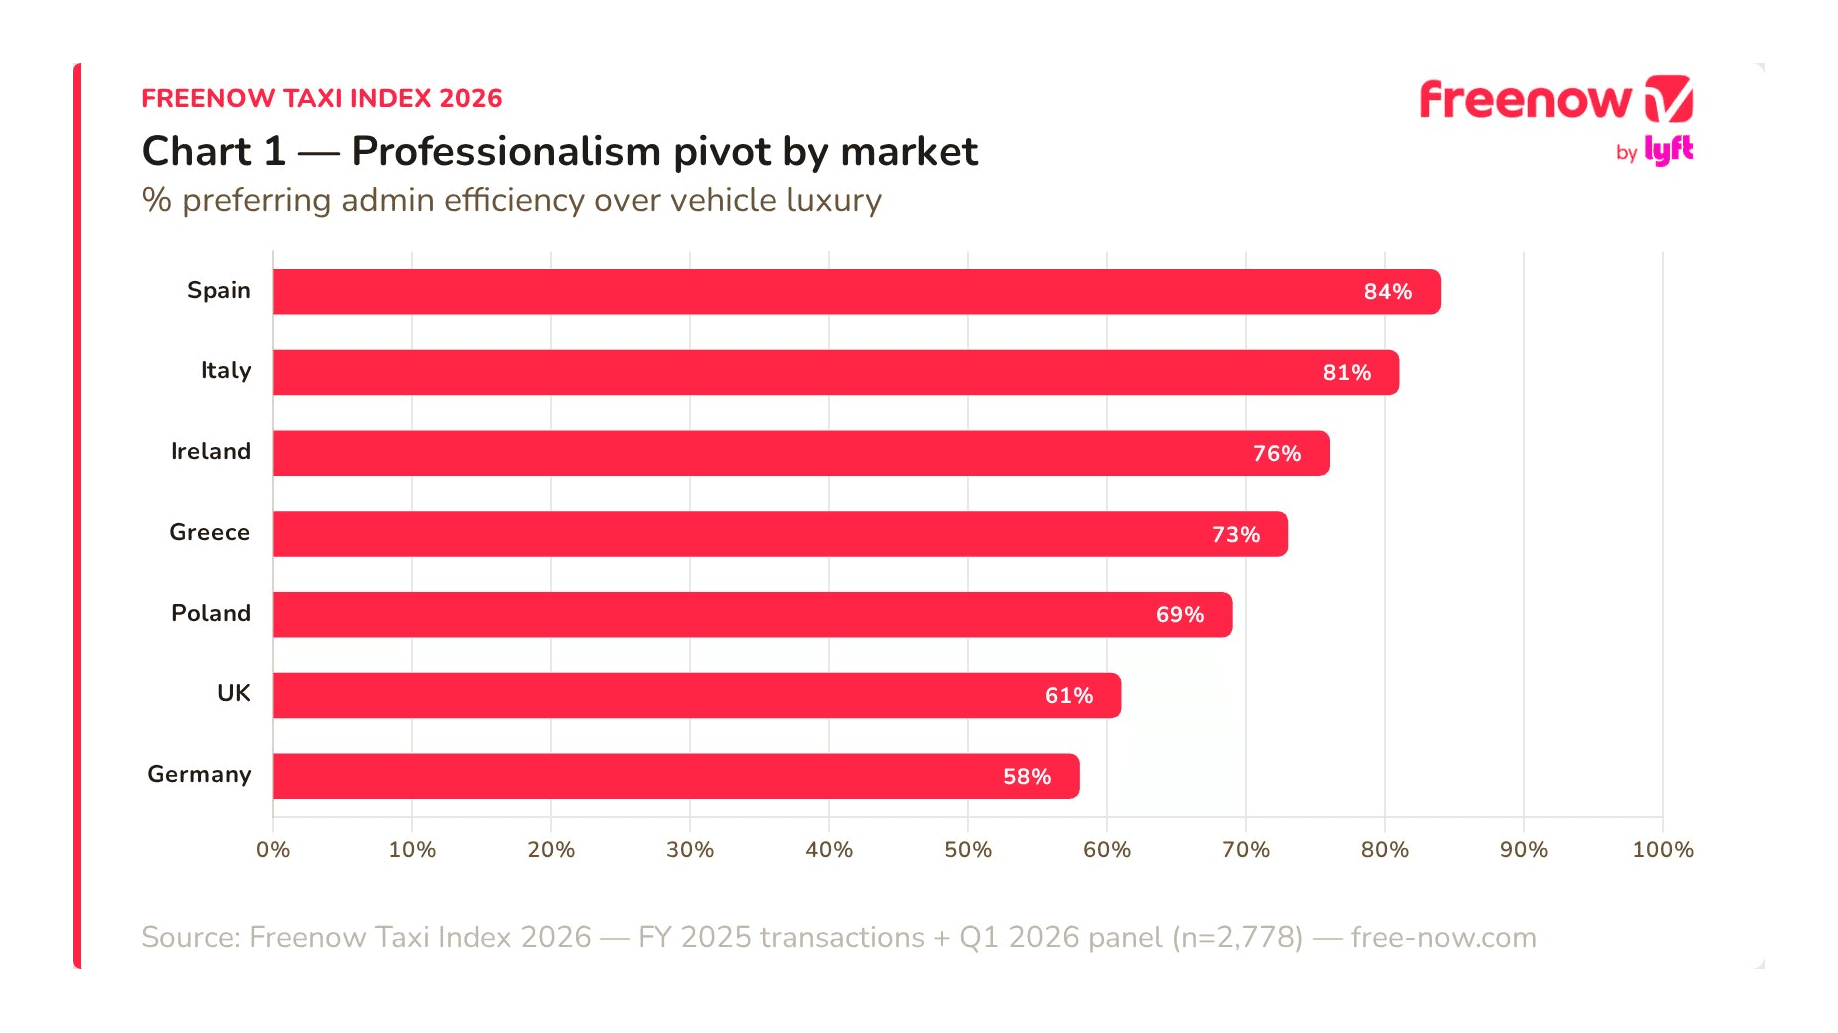
Across all seven markets surveyed, between 58% and 84% of business travellers chose a “seamless digital experience where the admin is handled automatically” over the physical luxury of a premium vehicle. This preference for automation is most pronounced in Southern Europe, with Spanish and Italian users leading the charge for high-speed digital integration. For a business traveller, the true cost of a ride isn't measured in pennies on the base fare – it’s measured in time saved and stress avoided.
Amount of European business travellers for whom admin efficiency is the primary sign of professionalism:
up to 84%
TABLE: Per-market preference for administrative automation
Market | % preferring admin efficiency over luxury |
Spain (ES) | 84% |
Italy (IT) | 81% |
Ireland (IE) | 76% |
Greece (GR) | 73% |
Poland (PL) | 69% |
United Kingdom (UK) | 61% |
Germany (DE) | 58% |
The four pillars of modern corporate mobility: What do business travellers want?
When analyzing ride-hailing preferences across Europe, corporate riders consistently prioritize administrative automation over traditional perks. This shift in sentiment changes how users select their mobility partners. When we look at selection criteria for business trips, four factors consistently rise to the top:
Safety
Speed and reliability
Ease of payment
Driver quality
Safety is the baseline expectation. It is exactly why licensed taxis and regulated platforms hold a structural advantage in corporate travel policy. For travel managers and procurement teams, a licensed driver operating under a regulated framework removes an entire category of risk that informal, unregulated ride options simply cannot match.
Speed and reliability are where professional trust is won or lost – it is the ultimate cornerstone of ROI. For the business traveller, the most critical moments occur during peak transition times, specifically Monday to Friday between 07:00–10:00 and 16:00–19:00. During these high-stakes windows, Freenow focuses its operational density on best-performing corporate hubs and international airport transfers. Whether it’s catching a cab to an early morning flight from London Heathrow or rushing to a late-afternoon meeting at Berlin Brandenburg, the goal is minimal wait times. This reliability pays off: in FY 2025, business riders using Freenow took an average of 3.44 rides per month, compared with 2.73 for purely leisure users. That makes B2B users 33% more loyal than their B2C counterparts.
Ease of payment is where the administrative burden of corporate travel is either solved or painfully compounded. We’ve all experienced the distinct frustration of a missed connection or a lost paper receipt. For the 43–48% of 'ghost riders' currently paying privately and expensing later, migrating to a fully automated business profile represents the final step in eliminating the admin fatigue that has plagued corporate mobility for decades. By automating receipts, centralising invoicing and integrating directly with tools like SAP Concur and Amadeus Cytric, Freenow ensures that the professional element of the trip begins the very moment the car is requested.
Driver quality is the factor that turns a functional journey into a pleasant one, and it is increasingly tied to sustainability credentials. When business travellers rate a driver highly, they're rating punctuality, vehicle condition and, in a growing number of cases, whether the vehicle is electrified*. Corporate sustainability goals have made driver quality and vehicle efficiency inseparable. The same traveller who values a smooth digital interface naturally expects the car that arrives to reflect their company's sustainable travel commitments.
Number of rides professional travellers take every month
3.44
Invisible automation: How Freenow by Lyft solves admin fatigue for business travellers
43–48% of European business travellers currently manage professional trips with personal cards, leading to significant industry-wide reimbursement friction.
- Over 95% of the Freenow team completed their mandatory data privacy and information security training (specifically 95% for Data Privacy and 95% for InfoSec)
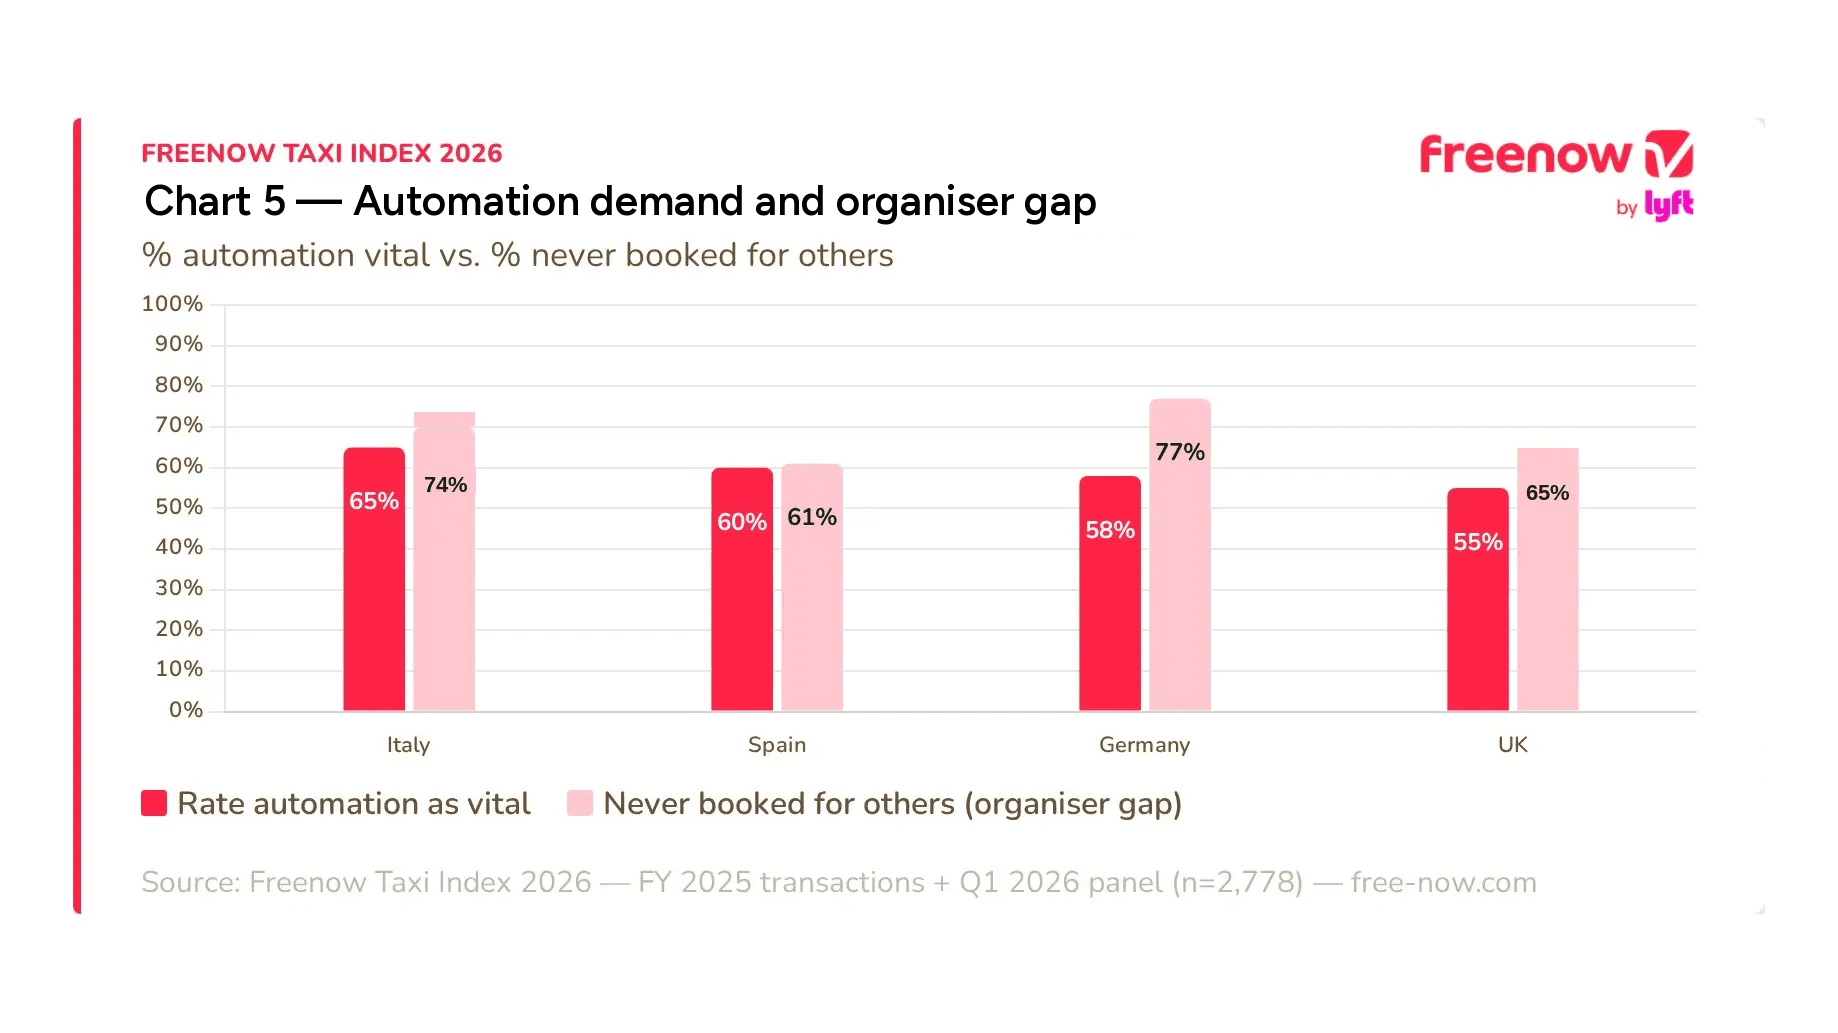
65% of professionals in Italy and 60% in Spain rate automated expense elimination as a vital requirement for their mobility partners.
Native integrations with SAP Concur and Amadeus Cytric eliminate the need for manual receipt collection by syncing data directly to expense management systems.
30% of administrative staff time is wasted on reconciling PDF invoices, a burden eliminated through Freenow’s centralised invoicing.
77% of German professionals have never used corporate organiser features, highlighting a significant opportunity to digitise guest and client bookings via the Web Booker.
According to Freenow Brand Tracker insights, between 43% and 48% of business-focused riders across Europe still pay for their professional journeys with a personal card and request a refund later. It is a market-wide drain on efficiency that essentially forces employees to act as short-term creditors for their own employers. Administrative friction is a quiet productivity killer across the European mobility sector.
At Freenow, we call these users "ghost riders". Our data shows that between 43% and 48% of business riders are hidden within the private travel ecosystem, paying privately and expensing later. Freenow's integrations are designed to migrate this percentage of users into a seamless automated business profile. By connecting the app to business travel systems like SAP Concur and Amadeus Cytric, the manual burden is removed entirely.
The value of this automation is recognised most noticeably in high-growth markets where digital efficiency is a top priority for the workforce.
While individual automation matters, there's a large untapped opportunity in how companies manage travel for others. Our data suggests that 61% of professionals in Spain and up to 77% in Germany have never booked a ride for a colleague or client through their work account in the last three months. This points to a heavy reliance on legacy booking methods that sit entirely outside corporate visibility.
To bridge this gap, Freenow offers the WebBooker, a dedicated tool within our Client Travel suite. It's free of charge and digitises the booking experience for third parties, particularly in hospitality. Instead of calling around for a taxi, a receptionist can book and track a ride digitally, giving the guest a modern experience while automating the company's records. It also removes the 30% of staff time typically lost to chasing or reconciling PDF invoices.
TABLE: Automation value & organizer role across 4 markets
Market | Automation Value (% "Must-Have" or "Nice-to-Have") | Organiser Role (% Never booked for others) |
Italy (IT) | 65% | 70% (avg) |
Spain (ES) | 60% | 61% |
Germany (DE) | 58% | 77% |
UK (GB) | 55% | 68% (avg) |
Sustainability mandate: Why 61% of Freenow's B2B trips are electrified
61% of Freenow B2B ride volume is electrified, outperforming the total platform average.
79% of shared vehicle trips were fully electrified
69% of new vehicles added to the platform in 2025 were electrified for long-term fleet sustainability.
Range anxiety is cited by 55% of drivers as the primary barrier to full adoption, marking a clear infrastructure need.
Targeted B2B adoption proves that sustainability in professional travel is a measurable behaviour, not just a preference.
During the full year 2025, Freenow recorded that 61% of all B2B rides were completed in electrified vehicles. This figure is particularly significant when compared to the platform-wide average of 51%. Professional travellers are nearly 10% more likely to use sustainable transport options than leisure users. This adoption isn't just a result of good intentions; it reflects the integration of lower-carbon fleet requirements into standard Business Travel operations.
The expansion of this sustainable infrastructure is accelerating. Our 2025 data shows that 69% of all new vehicles added to the platform were electrified. This fleet evolution has resulted in a tangible environmental impact, with Freenow's 2025 Sustainability Report calculating a 79% of shared vehicle trips were fully electrified.
Understanding the sustainability mandate requires looking at the full mobility ecosystem. The full picture of sustainability includes those behind the wheel. Freenow surveyed 1,725 professional drivers across seven markets to identify the practical hurdles of electrification. 55% cited range anxiety as the top barrier, a finding supported by the European Alternative Fuels Observatory.
Freenow is better positioned to support the professional drivers who make corporate travel possible. For corporate partners, this means Freenow delivers sustainable travel through a verifiable electrified marketplace.
TABLE: Freenow's platform sustainability metrics
Metric | Figure |
B2B rides electrified | 61% |
All-platform rides electrified | 51% |
New vehicles added that are electrified | 69% |
Drivers citing range anxiety as top barrier | 55% of 1,725 surveyed |
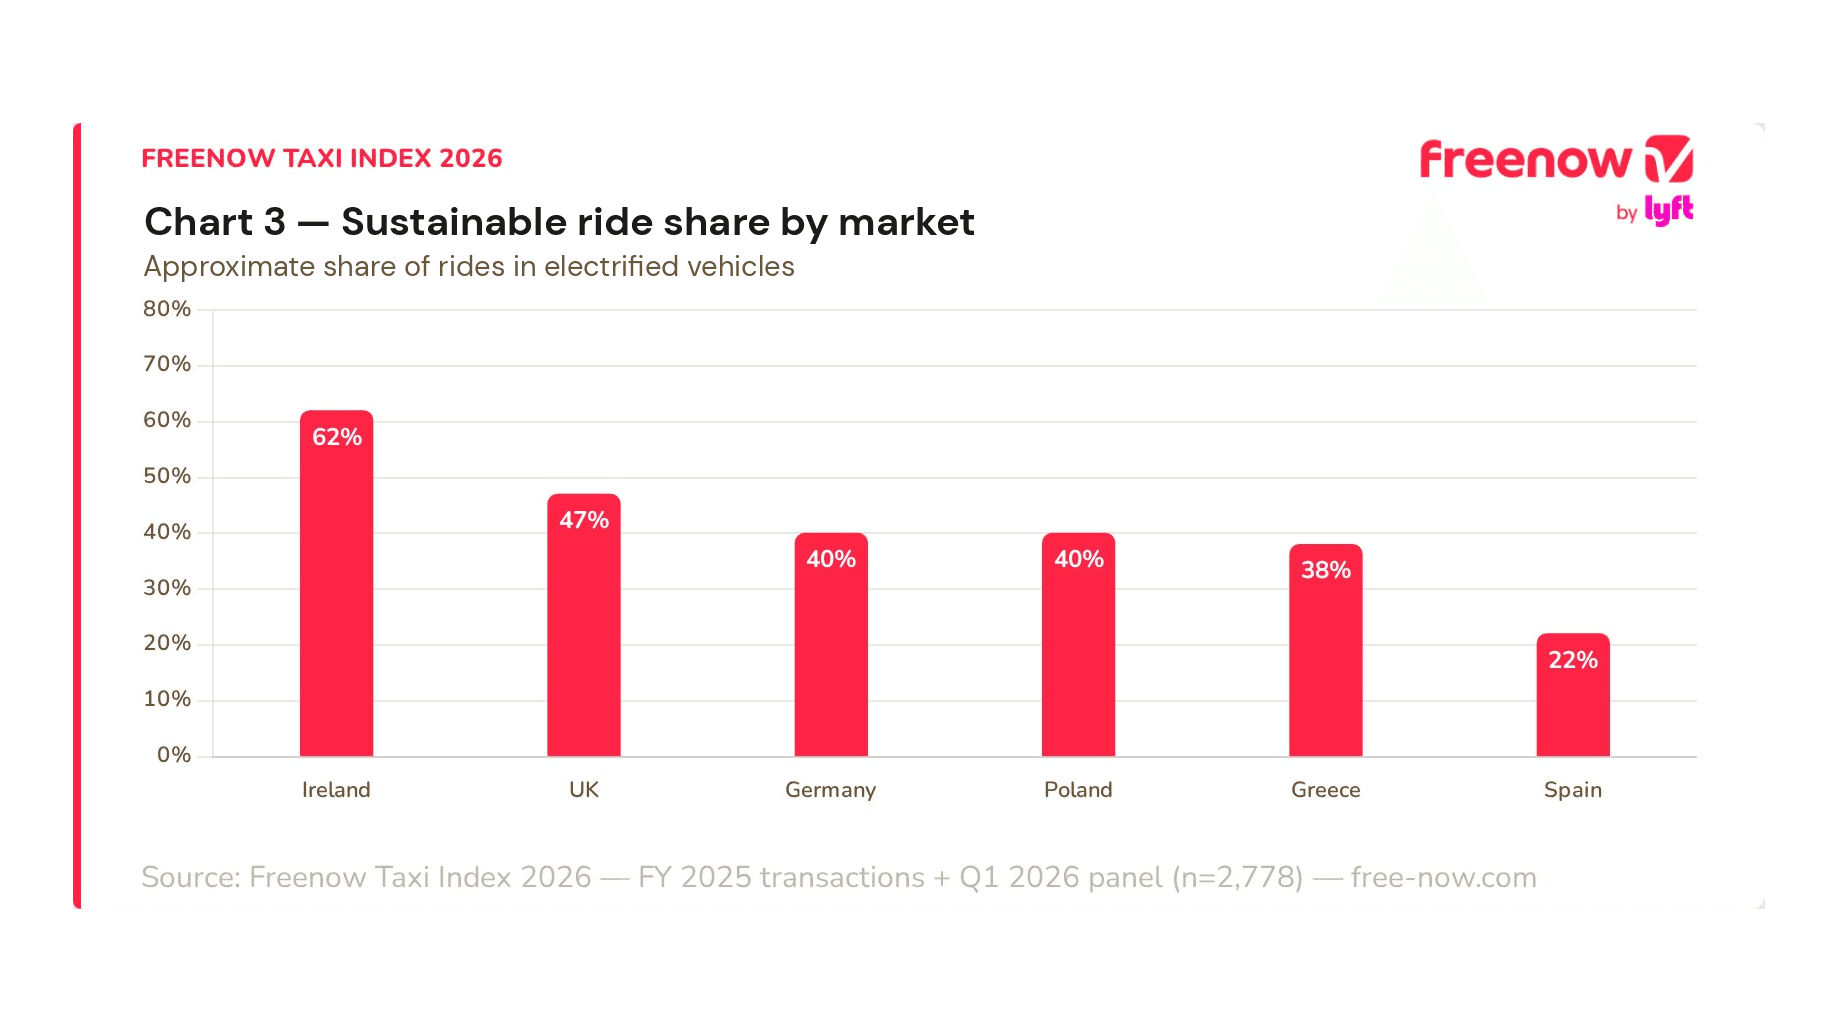
TABLE: Electrified ride prevalence by market
Market | Electrified ride share (approx.) |
DE | ~40% of rides |
ES | ~22% of rides |
IT | Data incomplete |
UK (GB) | ~47% of rides |
IE | ~62% of rides |
PL | ~40% of rides |
GR | ~38% of rides |
The B2B traveller data snapshot
This section consolidates the core performance metrics and user behaviours that define professional mobility in 2026. By triangulating transactional data from FY 2025 with current user intent, we identified the high-value patterns that separate corporate travel from the wider leisure market.
.png&w=3840&q=75)
B2B advantage: Why business ride-hailing users are 33% more loyal
The most significant distinction between user segments lies in their engagement levels. Professionals who integrate business travel into their daily workflows demonstrate a consistent, high-frequency usage pattern.
While leisure users may switch between platforms based on short-term factors, B2B users are 33% more loyal to Freenow because the platform solves for administrative friction and on-time arrival.
This increased frequency is a direct result of the reliability pivot discussed in earlier sections.
By how much are B2B travellers more loyal than leisure users?
33%
TABLE: B2B vs B2C loyalty & frequency
Segment | Avg. Rides per Month | Relative Loyalty |
B2B Users | 3.44 | 33% more loyal |
B2C Users | 2.73 | Baseline |
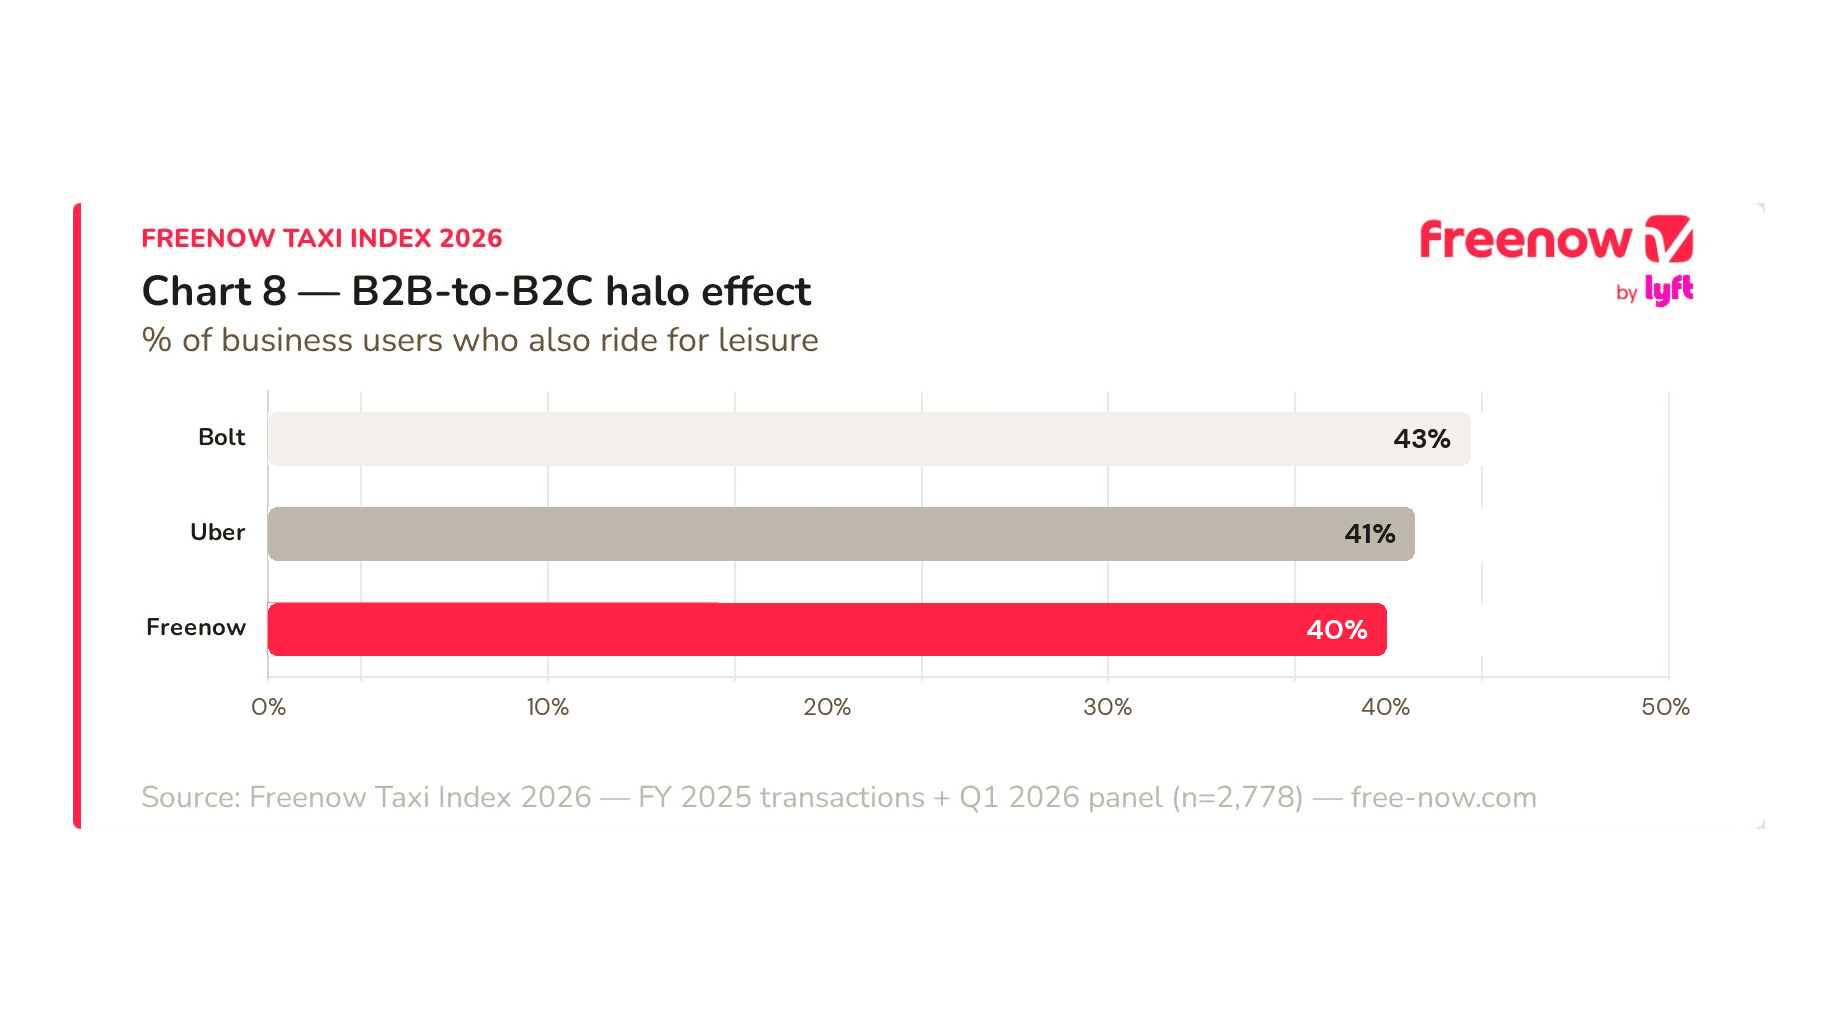
B2B trust as the driver for B2C growth: 40% of Freenow business users also use the app for leisure
When a user relies on Freenow for critical corporate journeys, that reliability translates into leisure-time preference: 40% of Freenow business users also use the app for personal trips. Simply put, winning the trust of a professional traveller has a direct effect on their personal mobility choices.
This crossover rate puts Freenow right on par with major market competitors:
Freenow: 40%
Uber: 41% (Market comparison)
Bolt: 43% (Market comparison)
B2B trust is the primary engine for B2C volume growth, as users naturally prefer a single, trusted interface for all their transport needs.
.png&w=3840&q=75)
Transit hub authority: Why presence at key travel moments matters
Freenow's authority is built at the specific moments that define a successful business trip. We measure this reliability through airport share and train station share, identifying how often the platform is used for critical arrival and departure transitions.
The table in this section shows Freenow share of rides from and to transit hubs like airports and train stations across all major cities in markets that were part of this research.
Whether booking airport transfers or navigating a busy tech hub, professional travellers prioritise the platform that maintains high operational density at high-pressure locations.
TABLE: Airport vs train station share across markets
City | Market | Airport share | Train station share |
Berlin | DE | 7.5% | 6.9% |
Hamburg | DE | 13.0% | 4.5% |
Munich | DE | 6.1% | 5.5% |
Frankfurt | DE | 14.8% | 6.8% |
Madrid | ES | 10.1% | 8.8% |
Barcelona | ES | 10.4% | 2.2% |
Valencia | ES | 8.4% | 4.6% |
Seville | ES | 11.7% | 14.3% |
Rome | IT | 9.6% | 10.0% |
Milan | IT | 11.2% | 11.9% |
London | UK | 3.1% | 5.6% |
Athens | GR | 1.8% | 2.0% |
Thessaloniki | GR | 5.1% | 7.0% |
Warsaw | PL | 5.5% | 3.4% |
Gdańsk | PL | 5.3% | 3.5% |
Kraków | PL | 6.2% | 6.3% |
Wrocław | PL | 4.2% | 4.5% |
Dublin | IE | 9.0% | 0.6% |
Cork | IE | 5.8% | 4.2% |
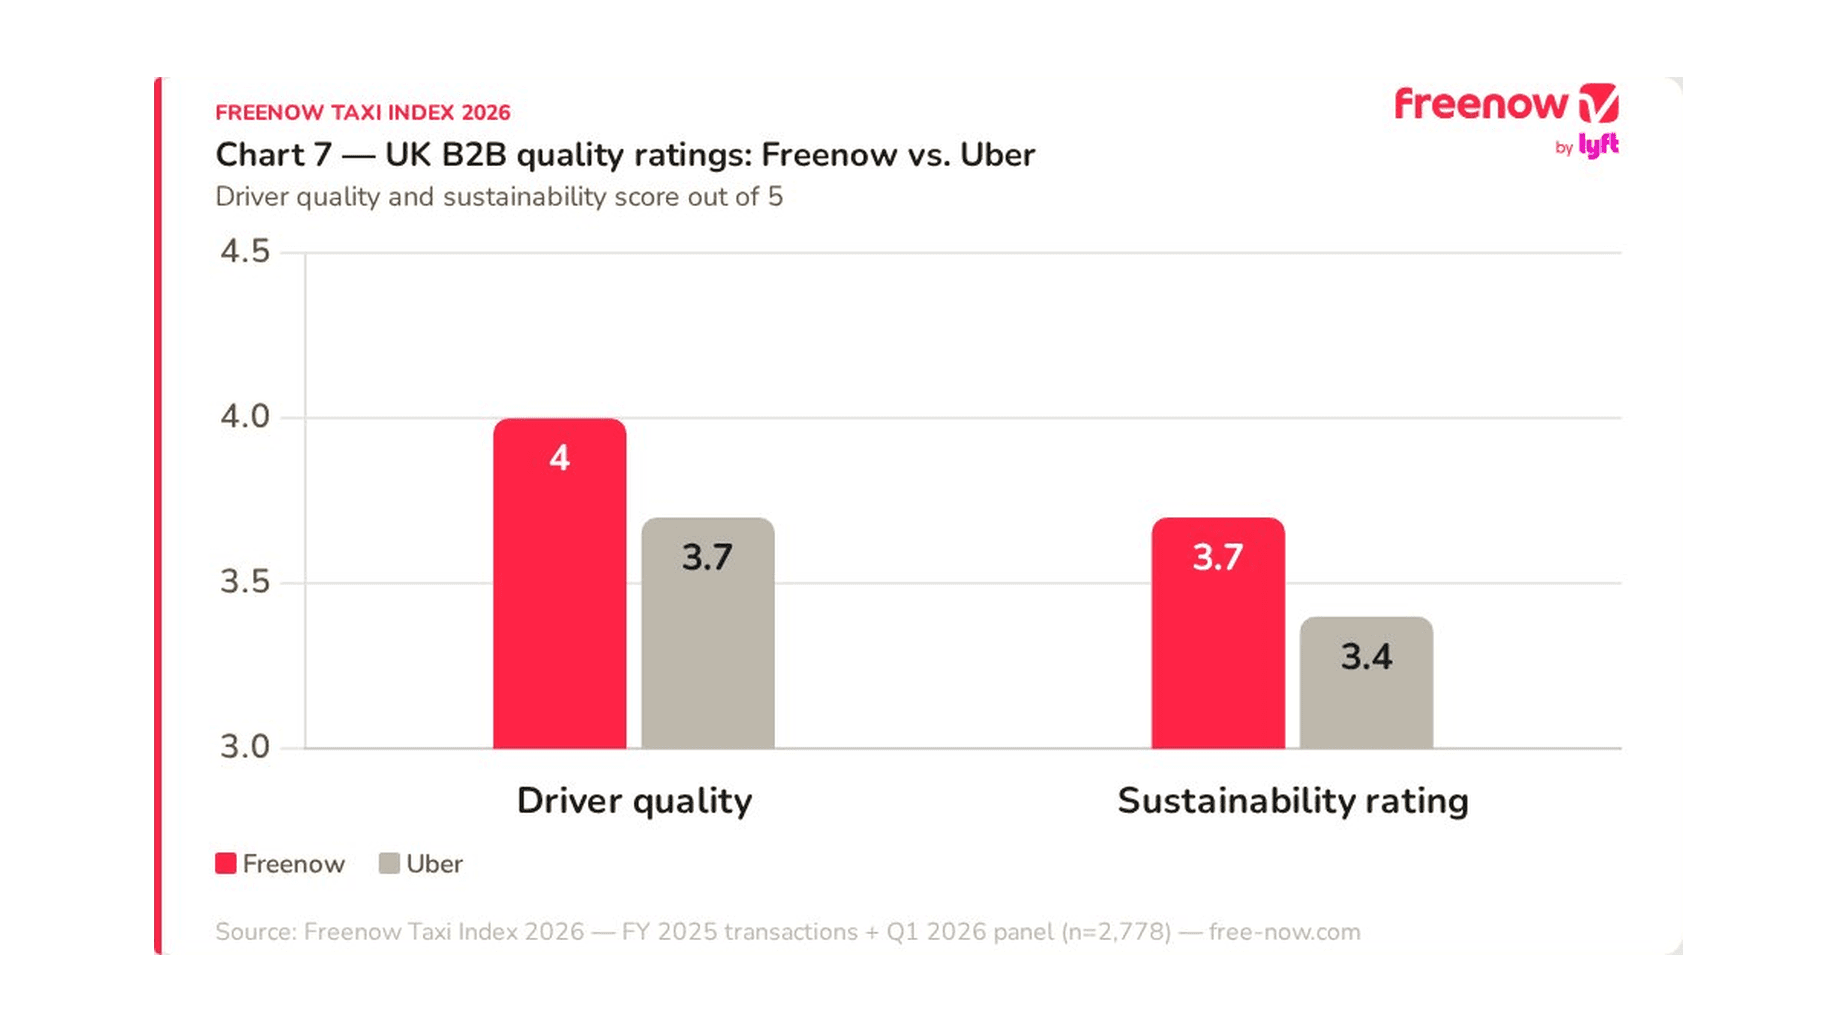
Two key segments where Freenow leads in UK's corporate market
In professional mobility, Freenow outperforms on the qualitative metrics that corporate travel managers value most: safety, sustainability and service quality. In the UK market, Freenow leads Uber on B2B-specific UX ratings. Freenow's driver quality is rated with 4, compared to Uber's 3.7, while Freenow's sustainability rating is 0.3 better than their competitor's, as well.
When looking for a taxi in London or other major UK hubs, business travellers cite driver quality as a primary reason for their platform preference.
TABLE: Freenow vs Uber in driver quality and sustainability
Metric (UK B2B) | Freenow | Uber |
Driver Quality | 4.0 | 3.7 |
Sustainability Rating | 3.7 | 3.4 |
Market-by-market breakdown
We have identified how professional standards and sustainability mandates vary by geography.
Germany: Automation and ESG across major hubs
Germany represents a beautifully balanced adoption of our corporate strategy, with 58% of business travellers prioritising administrative automation over vehicle luxury.
This focus on logic over status is consistent across Berlin, Hamburg, Munich and Frankfurt, where 58% ofusers also rate automated expense elimination as a vital service requirement.
Sustainability remains a core operational behaviour in the German market. Freenow supports these corporate sustainability goals through a B2B fleet electrification rate of 61%, providing high-density coverage in the nation’s primary economic centres.
Spain: Leading the European professionalism pivot
Spain records the highest professionalism score in Europe, with an incredible 84% of business travellers defining professional service through digital seamlessness rather than physical car quality. In Madrid, Barcelona and Valencia, the signal for admin fatigue is equally strong at 60%. Freenow solves this friction by automating the journey from booking to billing, successfully rescuing ghost riders who previously managed expenses manually. Explore our local services in Madrid and beyond to see this efficiency in action.
Italy: Automation as a priority in Rome and Milan
Italy leads all surveyed markets in its demand for invisible automation, with 65% of riders in Rome and Milan rating automated expense tools as an essential feature. This is paired with the second-strongest professionalism pivot in the region, as 81% of Italian users prioritise professional digital efficiency. Freenow meets this demand through native integrations with SAP Concur and Amadeus Cytric to make sure that the invoice burden is permanently eliminated for both the traveller and the finance department.
United Kingdom: The standard for B2B quality in London
In London, Freenow outperforms competitors on the qualitative metrics that matter most to corporate travellers. B2B users in the UK rate Freenow higher than Uber for Driver Quality (4.0 vs 3.7) and Sustainability (3.7 vs 3.4). Administrative automation is a priority for 55% of the UK professional workforce, making Freenow the preferred partner for business travel in the capital.
Ireland: Professionalism as the core driver in Dublin
76% of business travellers in Dublin choose seamless digital interfaces over traditional luxury markers. Freenow's presence in Dublin is built on trust and reliability, giving corporate users access to high-quality taxi services that meet professional standards.
Greece: Digital-first mobility in Athens and Thessaloniki
The Greek market shows a professionalism pivot of 73%, which marks a shift toward digital-first mobility in Athens and Thessaloniki.
Poland: Professional mobility in Warsaw and the Tri-City
In Warsaw and the Tri-City (Gdańsk, Gdynia and Sopot), 69% of business travellers define professionalism through reliable digital experiences.
Methodology & data transparency
Freenow establishes mobility insights through a triangulation model. Three primary data streams underpin all findings in this report.
The market scale layer uses an external Brand Tracker panel, running on a rolling basis from Q1 2025 through Q1 2026 across seven European markets. It features high response volumes, including approximately 950 German and 600 Spanish respondents per quarter.
User intent is captured through an internal panel survey conducted in Q1 2026. This five-question Qualtrics study was distributed via CRM to active users, resulting in 2,778 responses.
Operational behaviour is measured via aggregated transactional data from the full year 2025. This data is filtered for the B2B and hybrid traveller segment, ensuring findings are directly relevant to corporate business travel and sustainability targets. All metrics have undergone compliance and data privacy reviews to ensure no personally identifiable information (PII) is present, and findings are presented at city or country level only.
TABLE: Methodology & data transparency
Market | Responses (Q1 2026) |
Spain (ES) | 478 |
Greece (GR) | 446 |
Germany (DE) | 401 |
Poland (PL) | 388 |
Italy (IT) | 380 |
Ireland (IE) | 351 |
UK (GB) | 334 |
Talk to our team today
FAQs
What is the Freenow's corporate mobility report?
2026 Freenow's corporate mobility report is an annual authoritative report that establishes a definitive benchmark for European urban mobility by triangulating transactional data with deep-dive user intent surveys. It measures critical pillars such as B2B travel behaviour, sustainability adoption and administrative efficiency across seven key markets: Germany, Spain, the UK, Italy, Poland, Greece and Ireland.
What is the monthly ride frequency for Freenow business accounts?
As of Q1 2026, business-profile users complete an average of 3.44 rides every month. This high frequency confirms the essential role Freenow plays in daily corporate logistics.
Which transport hubs are most popular for Freenow business users?
Airport and train station shares are the primary behavioural metrics for the B2B segment. Freenow's authority is centered squarely on these high-stakes travel moments where reliability is the number one requirement.
How does Freenow compare to Uber for UK business travel?
In a B2B context, Freenow scores higher than Uber in the UK for both driver quality (4.0 vs 3.7) and sustainability (3.7 vs 3.4).
How does the Freenow halo effect work for business travellers?
The halo effect refers to the 40% of Freenow business users who also use the app for leisure trips. New travel habits stick; winning the trust of a professional for their work journeys naturally fuels booking volume for their personal mobility needs.
What is the Freenow B2B loyalty rate?
Based on FY 2025 data, B2B users are 33% more loyal than B2C users. These professional travellers take an average of 3.44 rides per month, compared to 2.73 for leisure riders.
Can companies report on their specific carbon footprint with Freenow?
Yes. Freenow provides detailed, transparent reporting for business accounts, allowing travel managers to easily see the percentage of electrified rides taken and the resulting impact on their Scope 3 emissions.
What are the main barriers to full fleet electrification?
Based on a survey of 1,725 drivers in Q1 2026, 55% cite range anxiety as the primary obstacle. Freenow addresses this by actively supporting infrastructure improvements and driver education.
Why are B2B users adopting EVs faster than B2C users?
Corporate users often operate under strict sustainability mandates that prioritise lower-emission vehicles. Operational data shows B2B electrification sits at 61%, while the general platform average is 51%.
What is the Freenow Green Fleet?
The Green Fleet refers to the selection of electrified and hybrid vehicles available through the Freenow app. As of FY 2025, 61% of all B2B rides in Europe were completed using these electrified options, helping companies seamlessly meet their ESG targets.
What do European business travellers value most in a taxi service?
Modern professionals prioritise administrative efficiency and digital seamlessness over traditional markers of luxury. Across seven European markets, between 58% and 84% of business travellers chose an automated digital experience over physical status symbols like premium car models or uniformed drivers.
What percentage of Freenow business rides are in electrified vehicles?
According to the 2026 data, 61% of all Freenow B2B journeys were completed in electrified vehicles during the last full reporting year. This high adoption rate outpaces the general platform average of 51%.
How does Freenow help companies manage business travel expenses?
Freenow eliminates administrative friction through native integrations with expense management platforms like SAP Concur and Amadeus Cytric, which completely automate the journey from booking to billing. These tools are specifically designed to rescue the 77% of “ghost riders” who pay privately and expense later, saving teams up to 30% of the time usually wasted on manual invoice reconciliation.
*Electrified including partially and fully electrified vehicles